In this case study, we are excited to share an insider’s perspective and look under the hood of how a Polygon.io customer, who recently joined our team, built an automated retail trading bot that is capable of monitoring the entire stock market in real-time. We now pass the baton to Justin, who will narrate his own captivating journey.
Hi, I’m Justin. The early versions of my bot could have easily won an award for ‘The Fastest Money-Losing Machine Ever’. But, after lots of trial and error, and iterative improvements, it evolved into a breakeven machine, and sometimes even turns a profit. It remains a work in progress, but the trajectory is promising. Keep in mind that my 3+ year journey with this led me to become so familiar with the platform, Polygon.io, that I joined their team to work on this type of stuff full time. I wanted to share my story as a blueprint for those who might want to attempt something similar.
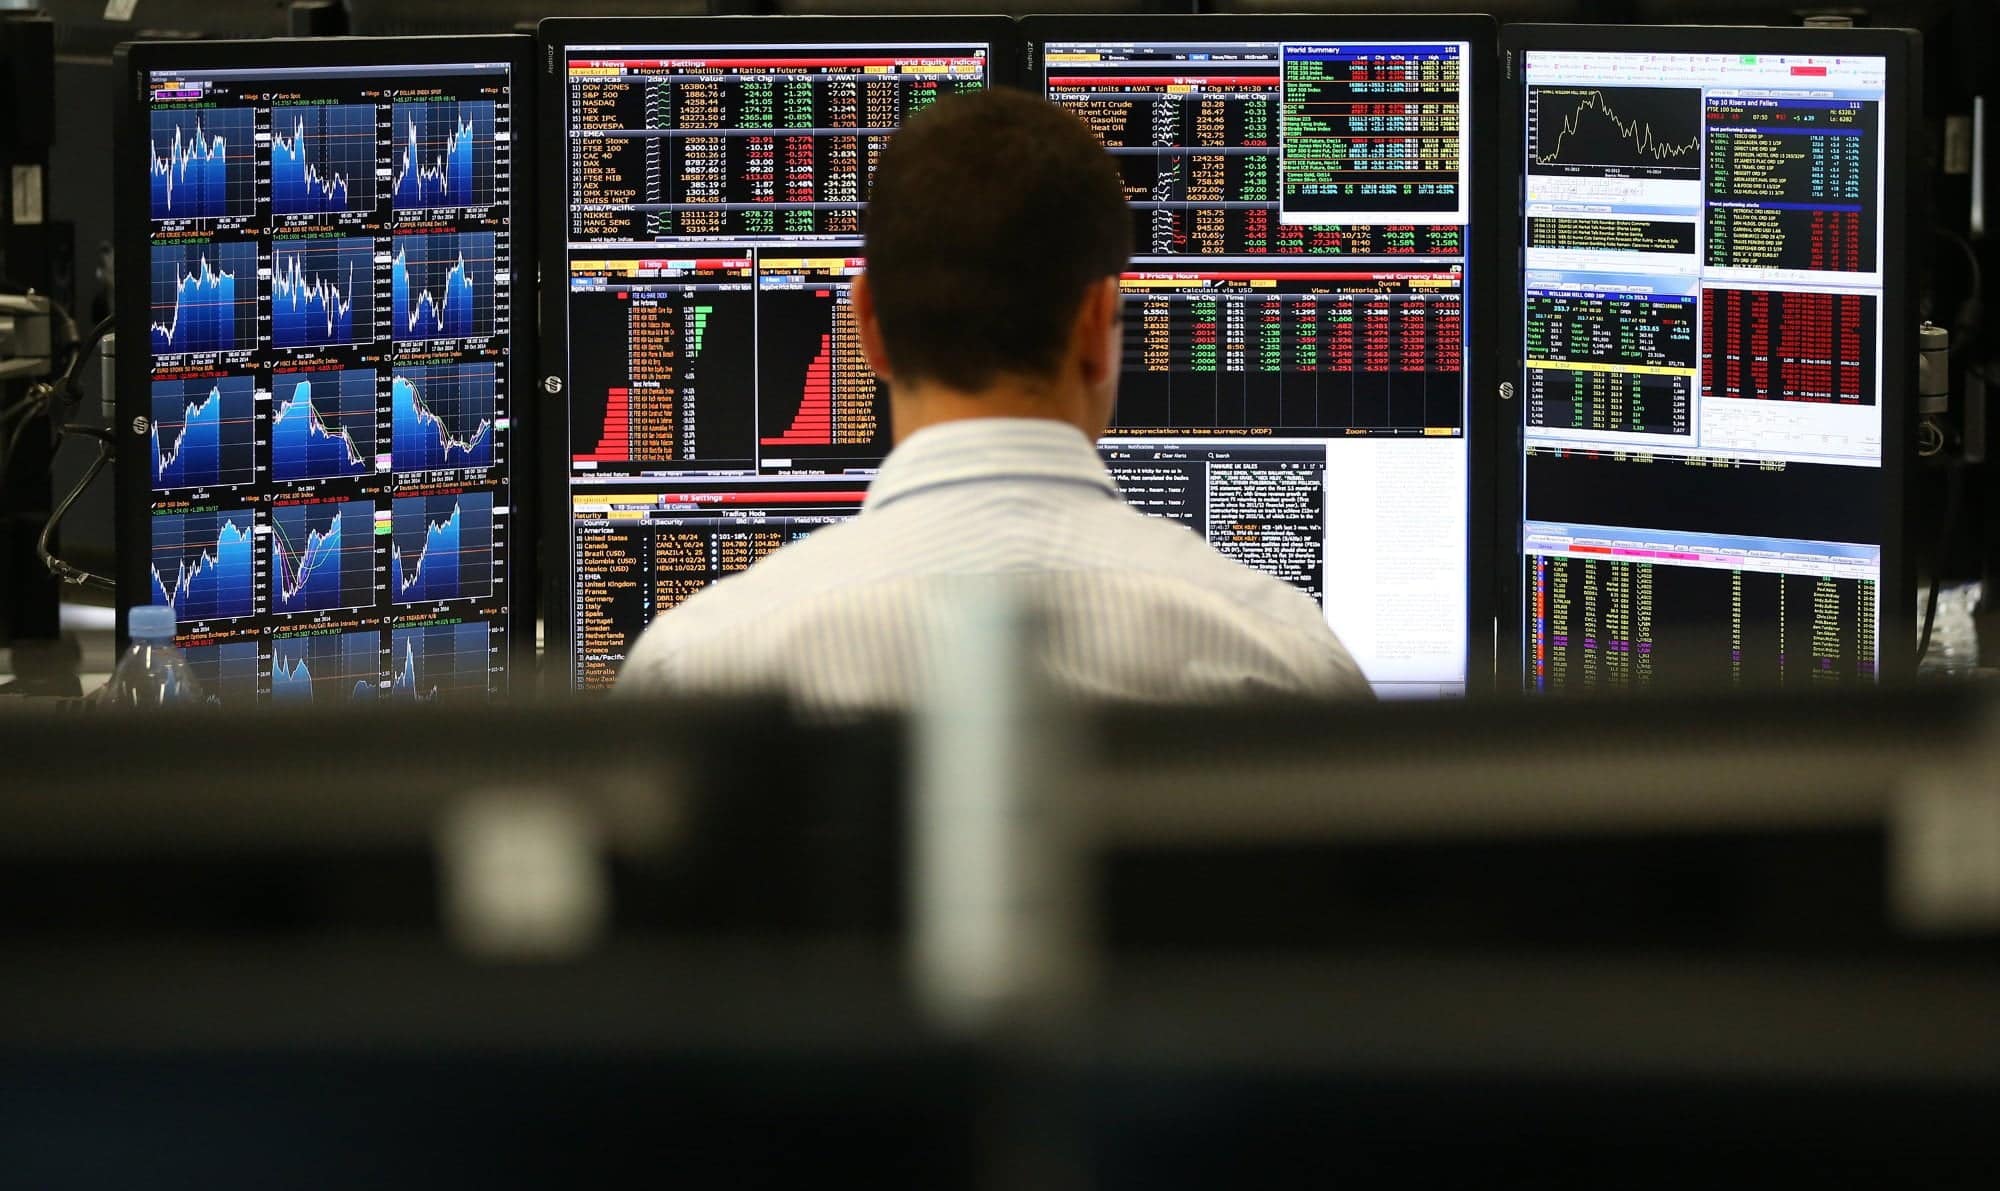
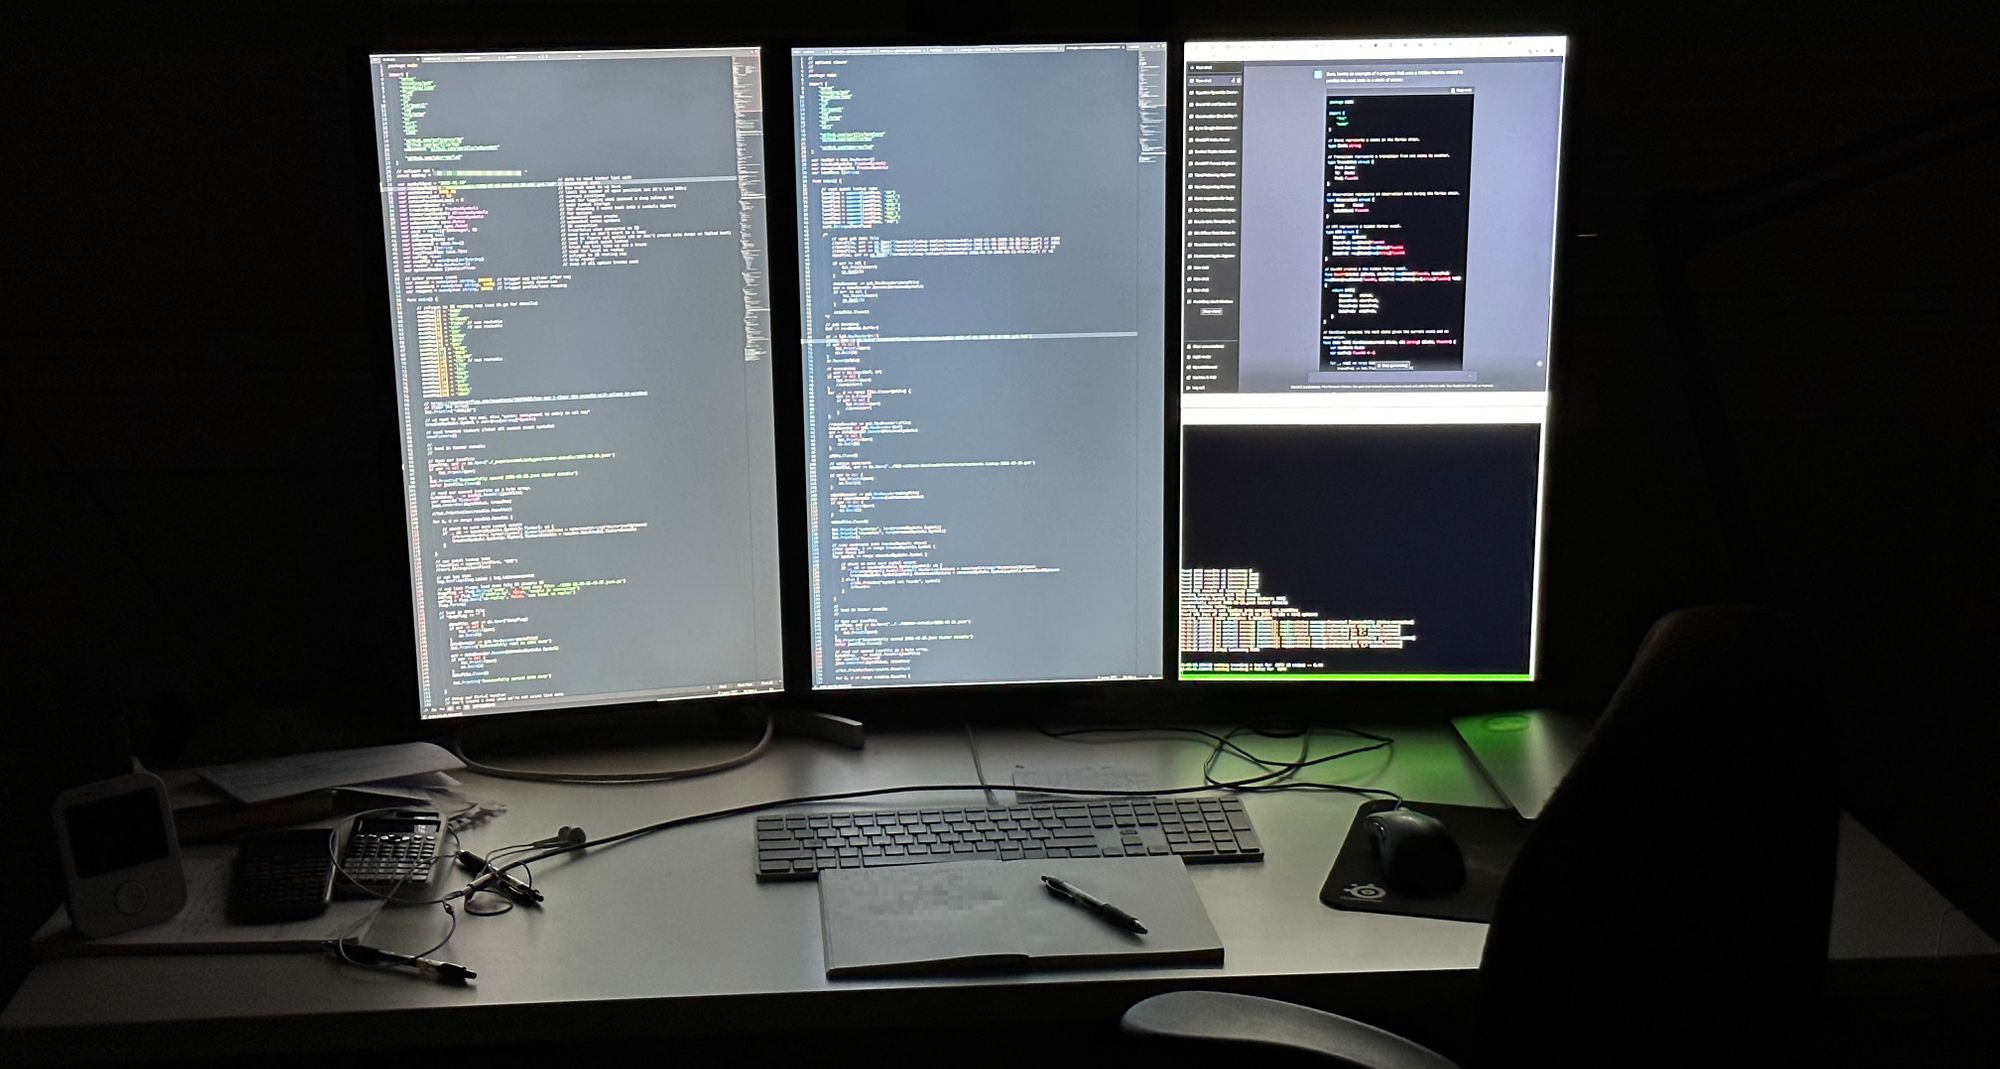
No tale of algorithmic trading would be complete without the obligatory screenshot of an impressive multi-monitor setup. Behold my data-driven empire, brought to life on three vertical 4K screens.
So, buckle up and join me as we navigate the exciting crossroads of finance, programming, and data analytics.
The Challenge
Have you ever had one of those ideas that you cannot shake? Sort of like a song that gets stuck in your head? Well, I’ve had that but for this stock trend following idea. The goal here is to automate the execution and management of around 500 short lived trades across the entire stock market and then take small profits off each trade.
My attempts at doing this manually underscored why this needed to be automated. First, there was the issue of human bandwidth, the risk associated with pouring all my investment into a single stock was astronomical, yet monitoring tens of short-lived bets was a task beyond my ability. Second, this strategy only worked with highly liquid stocks that allowed swift in-and-out trading, and even then, I did not want to acquire too many shares to make for faster fills at prices I liked.
Position management proved to be a massive issue for me. How do you track multiple bets, say 25+ at a time, all while timing the entries and exits was very complex. There was also the question of scalability. The strategy I am using only works with smaller amounts of money, so as my bank roll increased so did the amount of bets needed. Finally, the costs associated with trading – price spread, commissions, price slippage, API fees, and taxes – all need to be calculated quickly to see if this trade even makes sense. That’s how I started to explore automating it.
The Solution
The journey to develop an automated trading tool capable of monitoring over 5500+ stocks on the NYSE and NASDAQ in real-time and making quick trading decisions has taken a few years. It has been a constant cycle of trial, error, and lots of tweaking, a far cry from the few months I initially anticipated. The application is running under Linux on a high-powered gaming system with 16 cores, 128GB of RAM, and 8TB of NVMe storage via a 1Gbps internet connection.
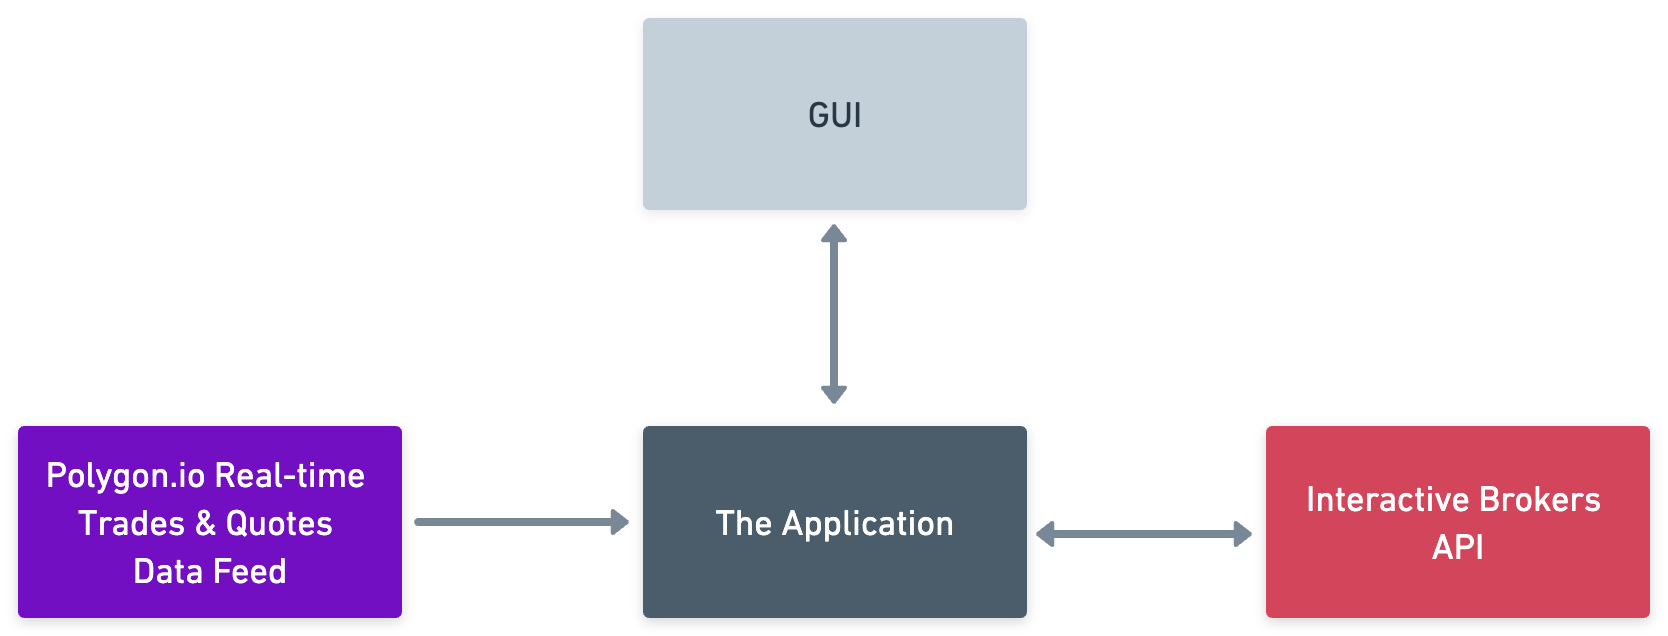
Here is a breakdown of the three fundamental components:
- Data Provider: Initially, I had no idea what to even search for here? Candlestick data? What was tick data? This was a massive learning curve and finding a reliable data feed had so many obstacles. Many providers had unconventional APIs, insisted on using their preferred programming languages, or required installation of obscure libraries. My lack of knowledge combined with these other factors created a highly cumbersome process. However, I hit the jackpot with Polygon.io. They have both historical and real-time data coverage of the entire market, developer friendly and intuitive APIs, and amazing documentation and libraries. I cannot express how much they stood out compared to everyone else. They also had a simple pricing model that gives you access to all market data without artificial limits like other providers.
- The Application: This Go app is basically the heart of the solution. It ingests and interprets the data feeds, makes calculated trading decisions, and translates these decisions into buy and sell orders. These orders are then sent to the broker API for execution. We will dive deeper into the specifics of the application in the following section.
- The Broker: When it came to finding a broker, my regular brokerage account did not provide an API. While I would like to say that I conducted extensive search, in reality, a quick Google search revealed that Interactive Brokers was the go-to choice for many. After checking their APIs and finding them to be quite straightforward, I decided to go with them.
Why Go, you might be asking yourself? A quick glance at any hedge fund job posting reveals that the industry leans heavily towards C++ and Python. But this project was for me. Having used Go for many years, I found it to be an excellent fit for processing a stream of data and interacting with another API. So, it just seemed so obvious.
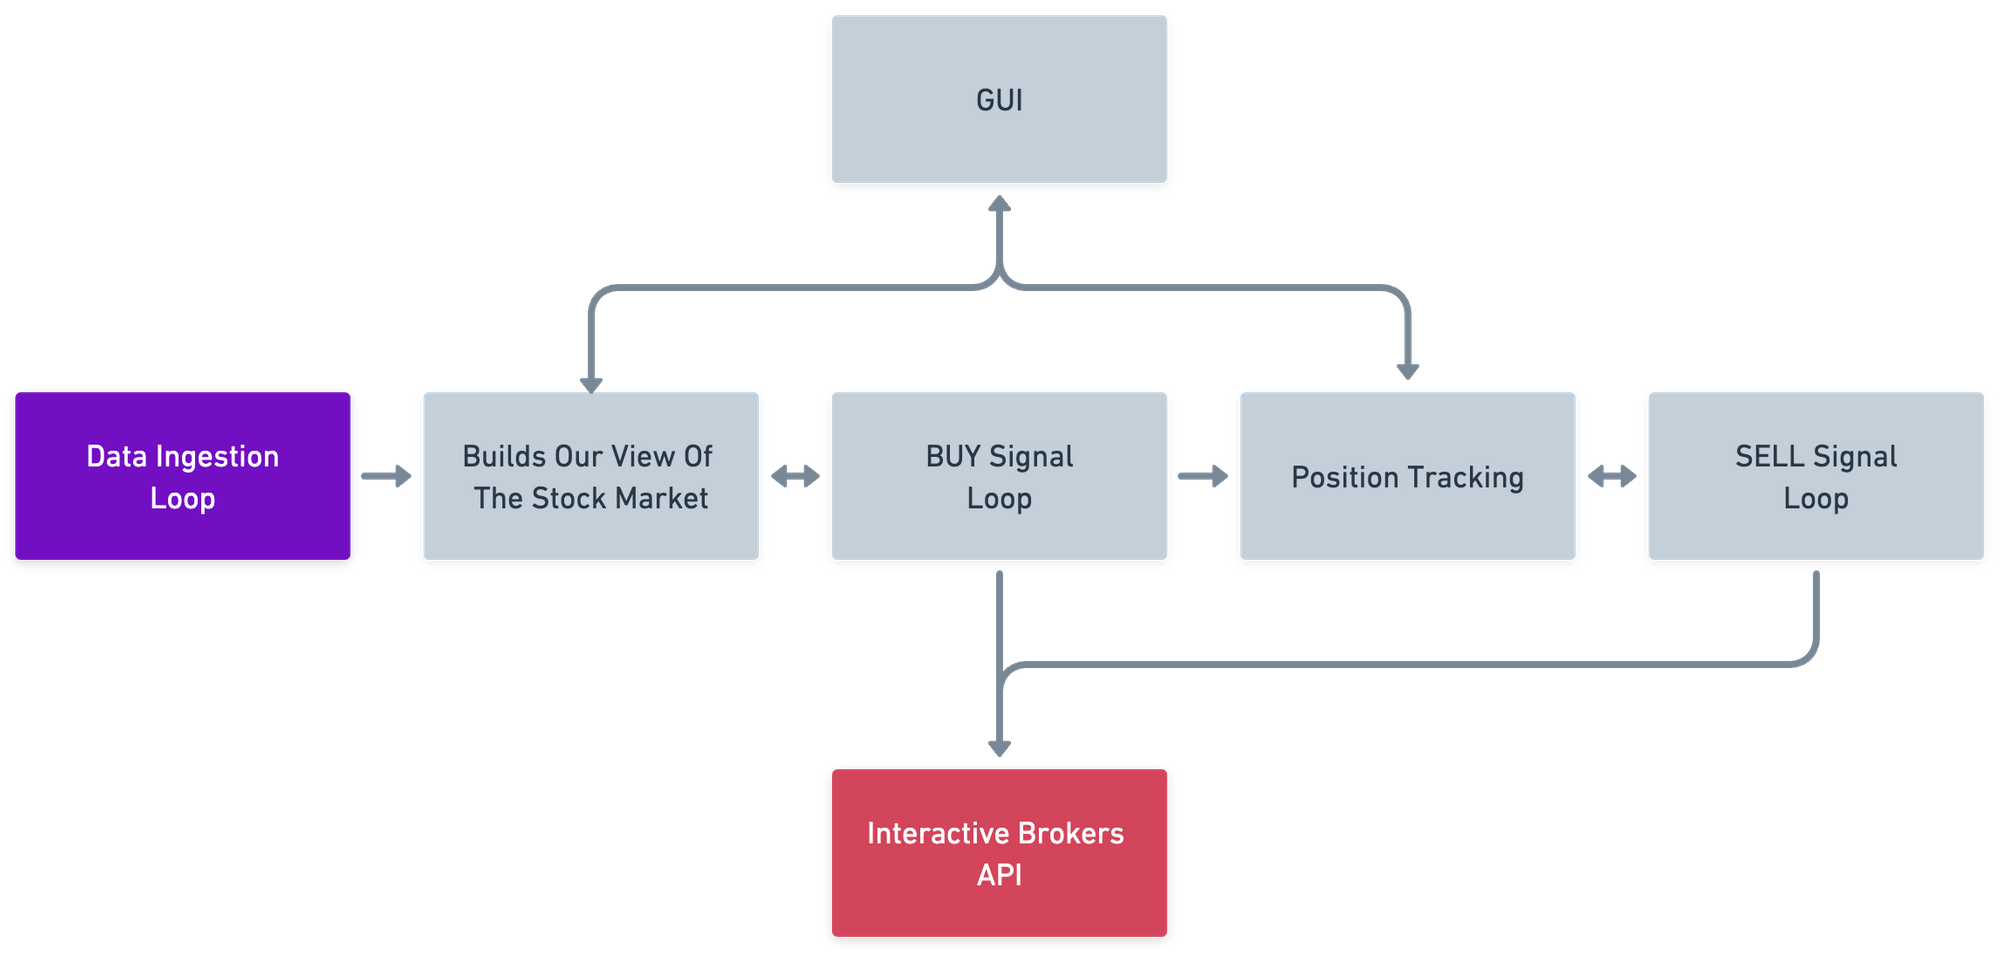
Let’s break down the main functions of the Go application:
- Data Ingestion Loop: This function is responsible for continuously gathering real-time data from over 5500+ stocks via polygon.io. The quality of data ingested at this step directly impacts every subsequent operation, so you want to put a lot of thought into this step and make it as simple as possible. Initially, I tried storing the data in a database but quickly realized that it couldn’t handle the high volume of events (upwards of 60k+ events per second at market open and close). Instead, I opted to store everything in memory and have not looked back.
- Build Our View Of The Stock Market: The application uses the ingested data to create a real-time, in-memory view of the entire market, tracking every stock (price, spread, trading activity, etc). This custom view allows the system to spot and trade on opportunities way before they hit mainstream news. This also gives you access to pre-market, regular market, and after hours trading activity.
- BUY Signal Loop: Upon spotting an opportunity, this function sends the broker an API request to place a buy order. But it’s not just a simple trigger. The function carries out pre-calculations such as estimating profit based on price spread, determining the number of shares needed, and factors in commissions and taxes. It also incorporates logic for situations where the price moves, or where we only get a partial fill, or maybe need to cancel the order if it doesn’t make sense any more.
- Position Tracking System: Once trades are executed and we own stock, it’s vital to monitor the positions. I consider this system like a vigilant shepherd overseeing its flock of positions. Essentially, it is a loop that continuously compares the position table with current prices, tracking gains and losses in real-time. There is also a GUI here where you can go and inspect the trade to see why it was triggered, what the current state is, and when it would sell. This has been instrumental in helping me refine the logic for the BUY and SELL loops.
- SELL Signal Loop: As crucial as knowing when to buy is knowing when to sell. This function calls the broker API to execute a sell order when the system detects a good exit (nice profit or we are losing too much money). Similar to the BUY function, this one incorporates complex logic too. It manages scenarios like updating the price for fast-moving stocks and handling partial fills.
At a glance, the core components might seem straightforward, but as time goes by and you encounter various corner cases, you will inevitably add more logic to these areas.
Screenshots
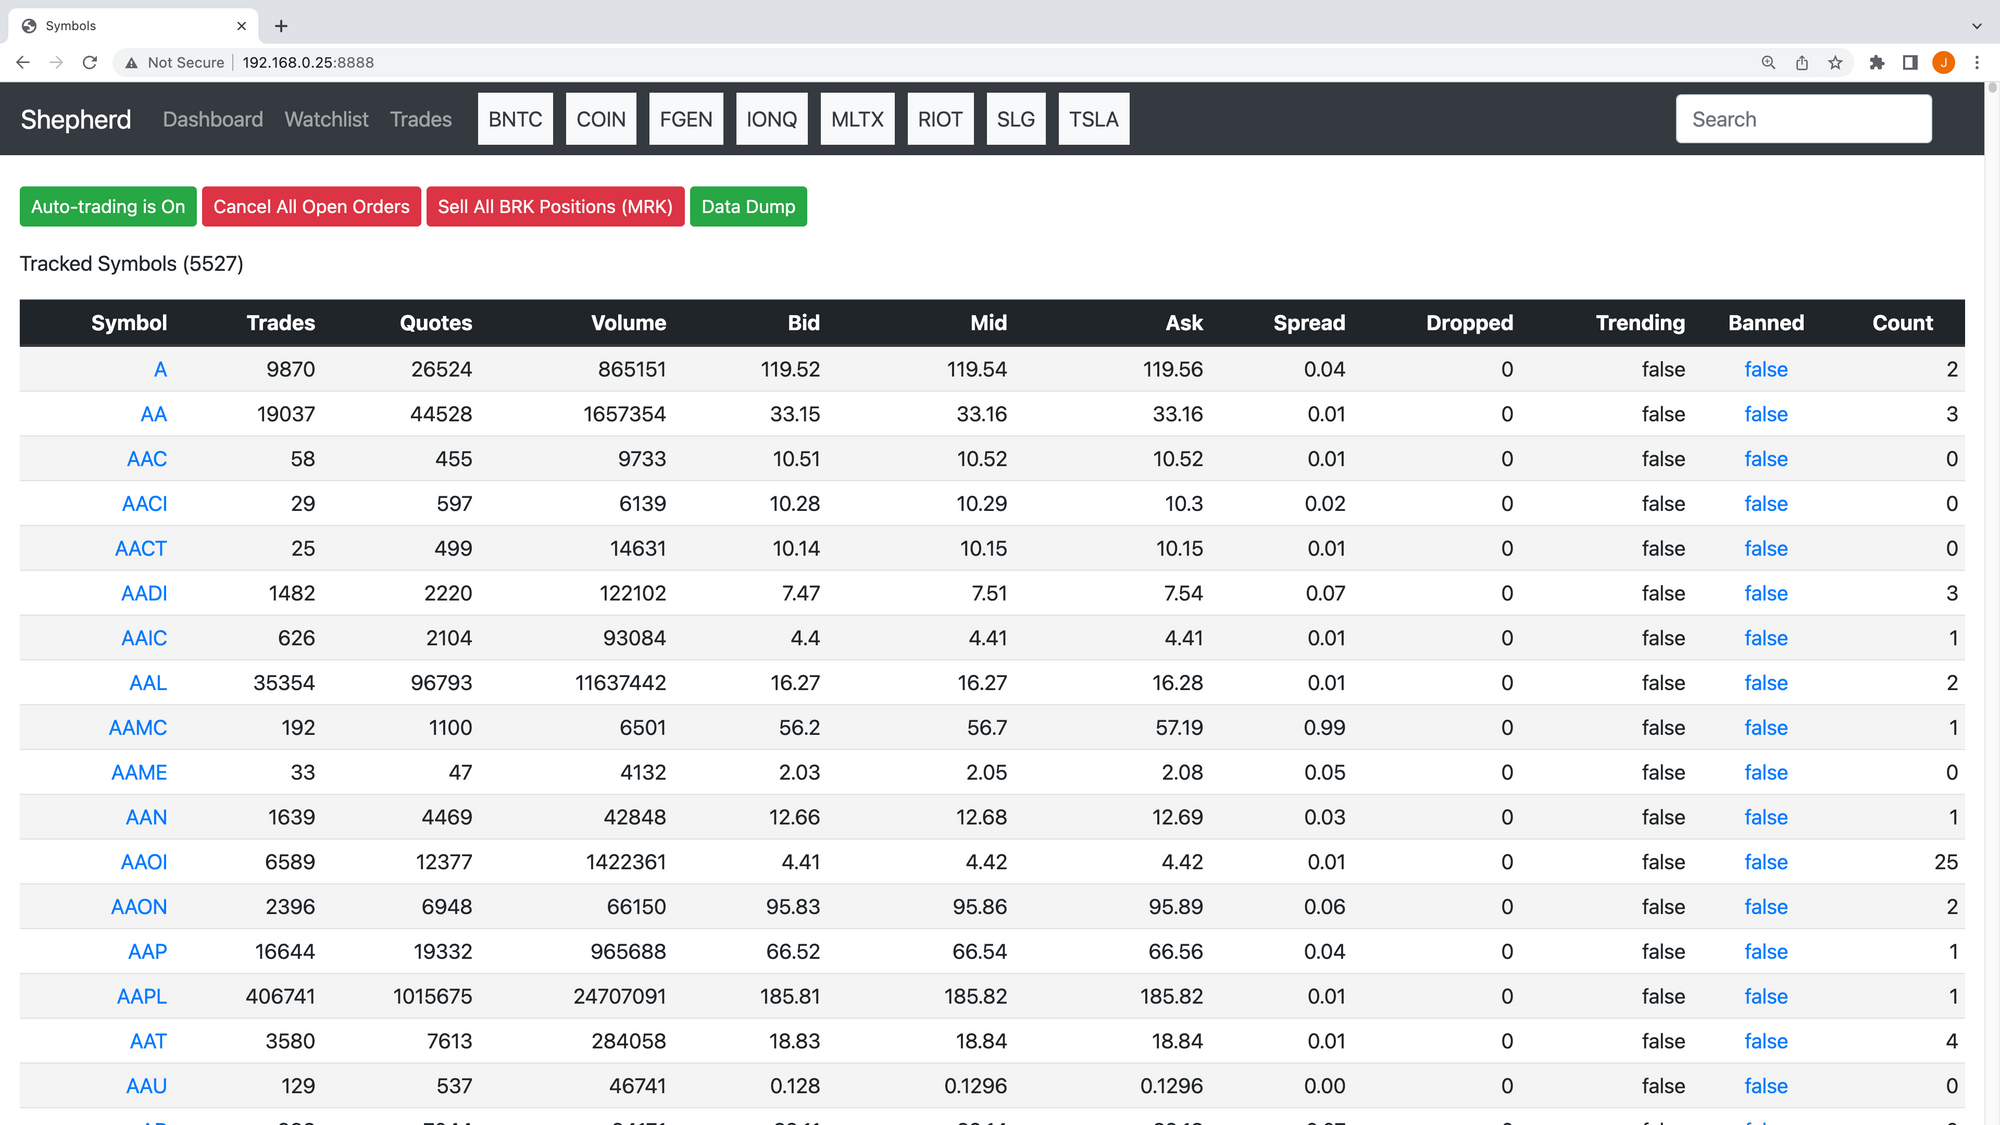
Having a built- in web interface has been immensely helpful in understanding the inner workings of a complex project, in that you can explore all of the data structures, visualize data, and dive deep into trades and see why they were triggered and their current status. To help bring this to life, I have included a series of screenshots. These not only offer a glimpse into the user interface of the trading system but also provide visual demonstrations of the system’s key structural and functional elements.
This is an overview of all 5500+ tickers, complete with their prices, spread, and other relevant data.
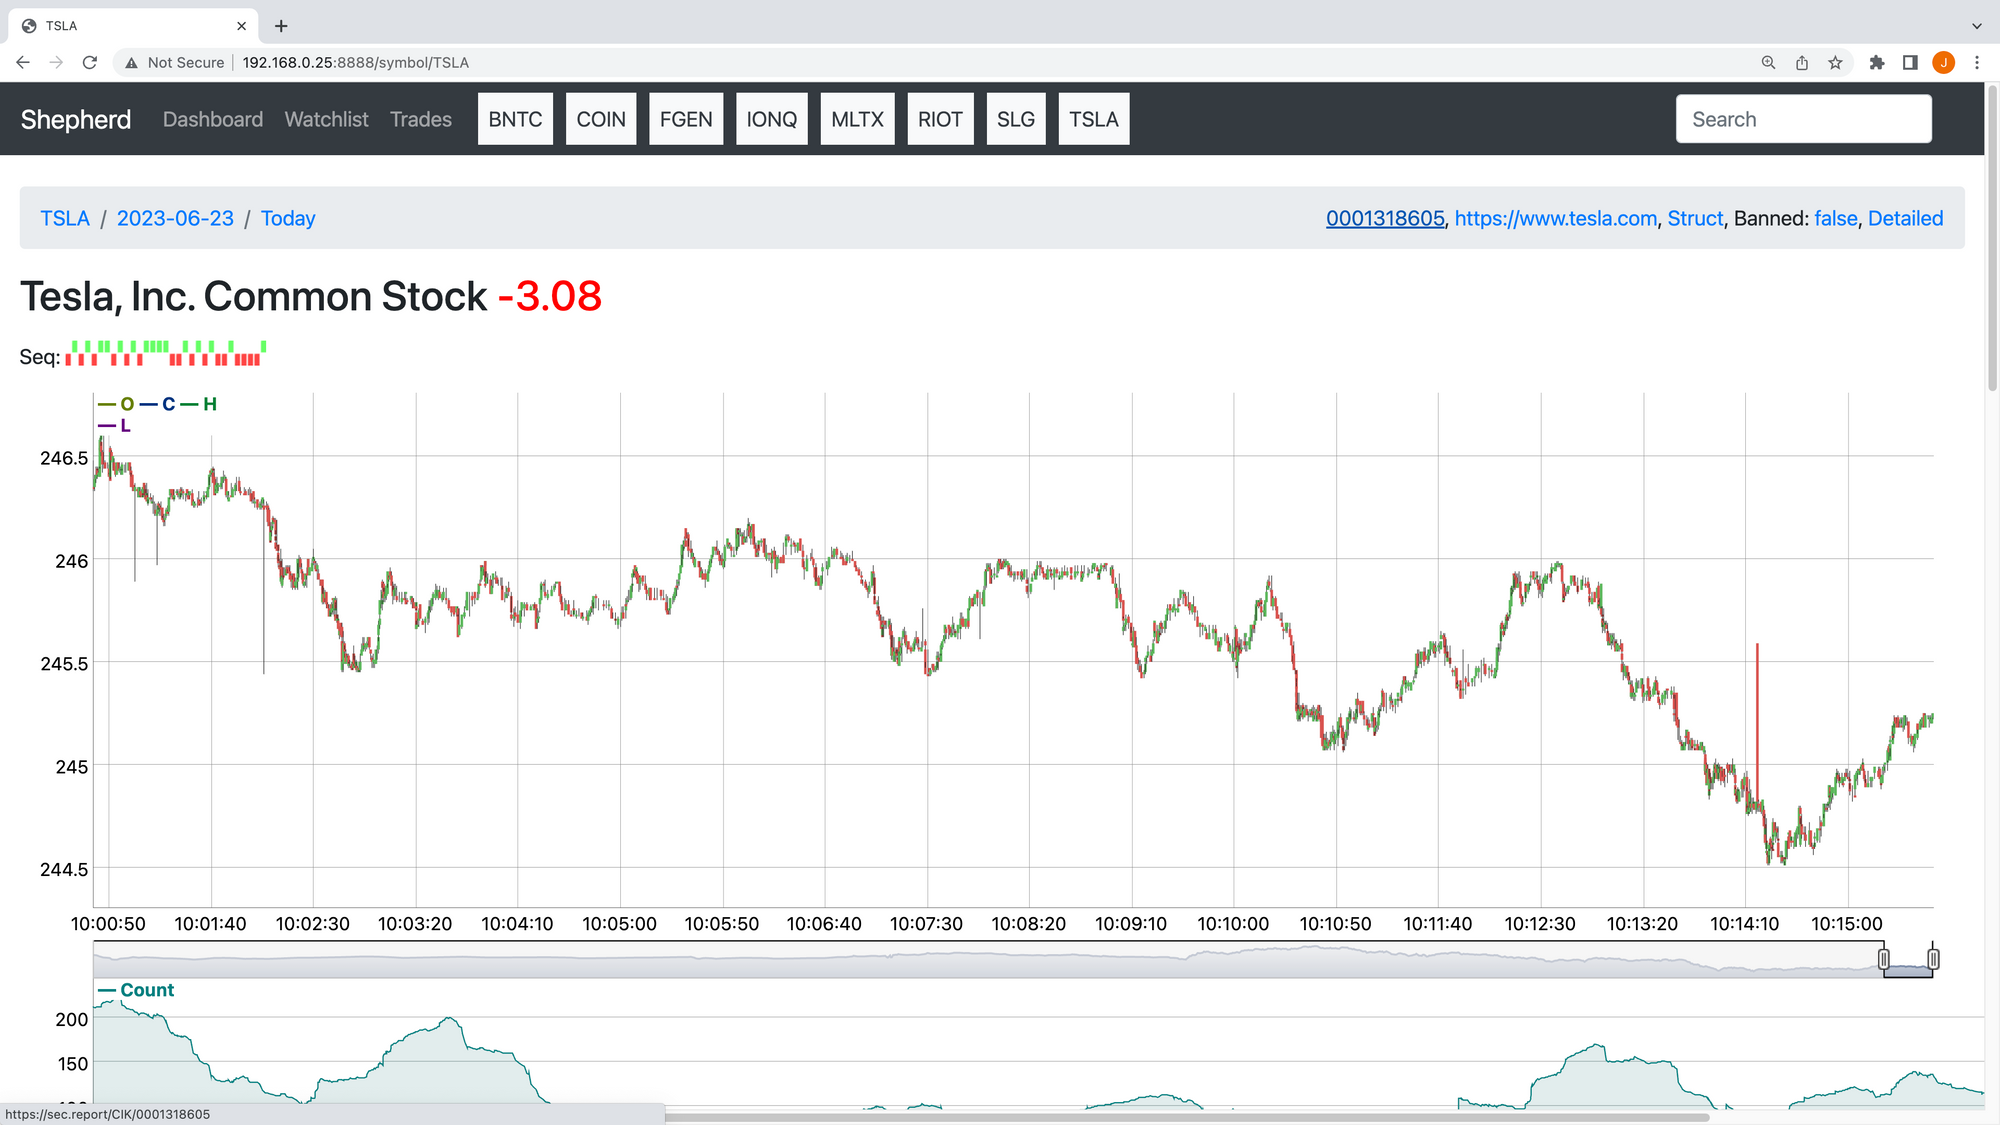
This is a specific symbol page for Tesla (TSLA), showing tick bars and other pertinent information.
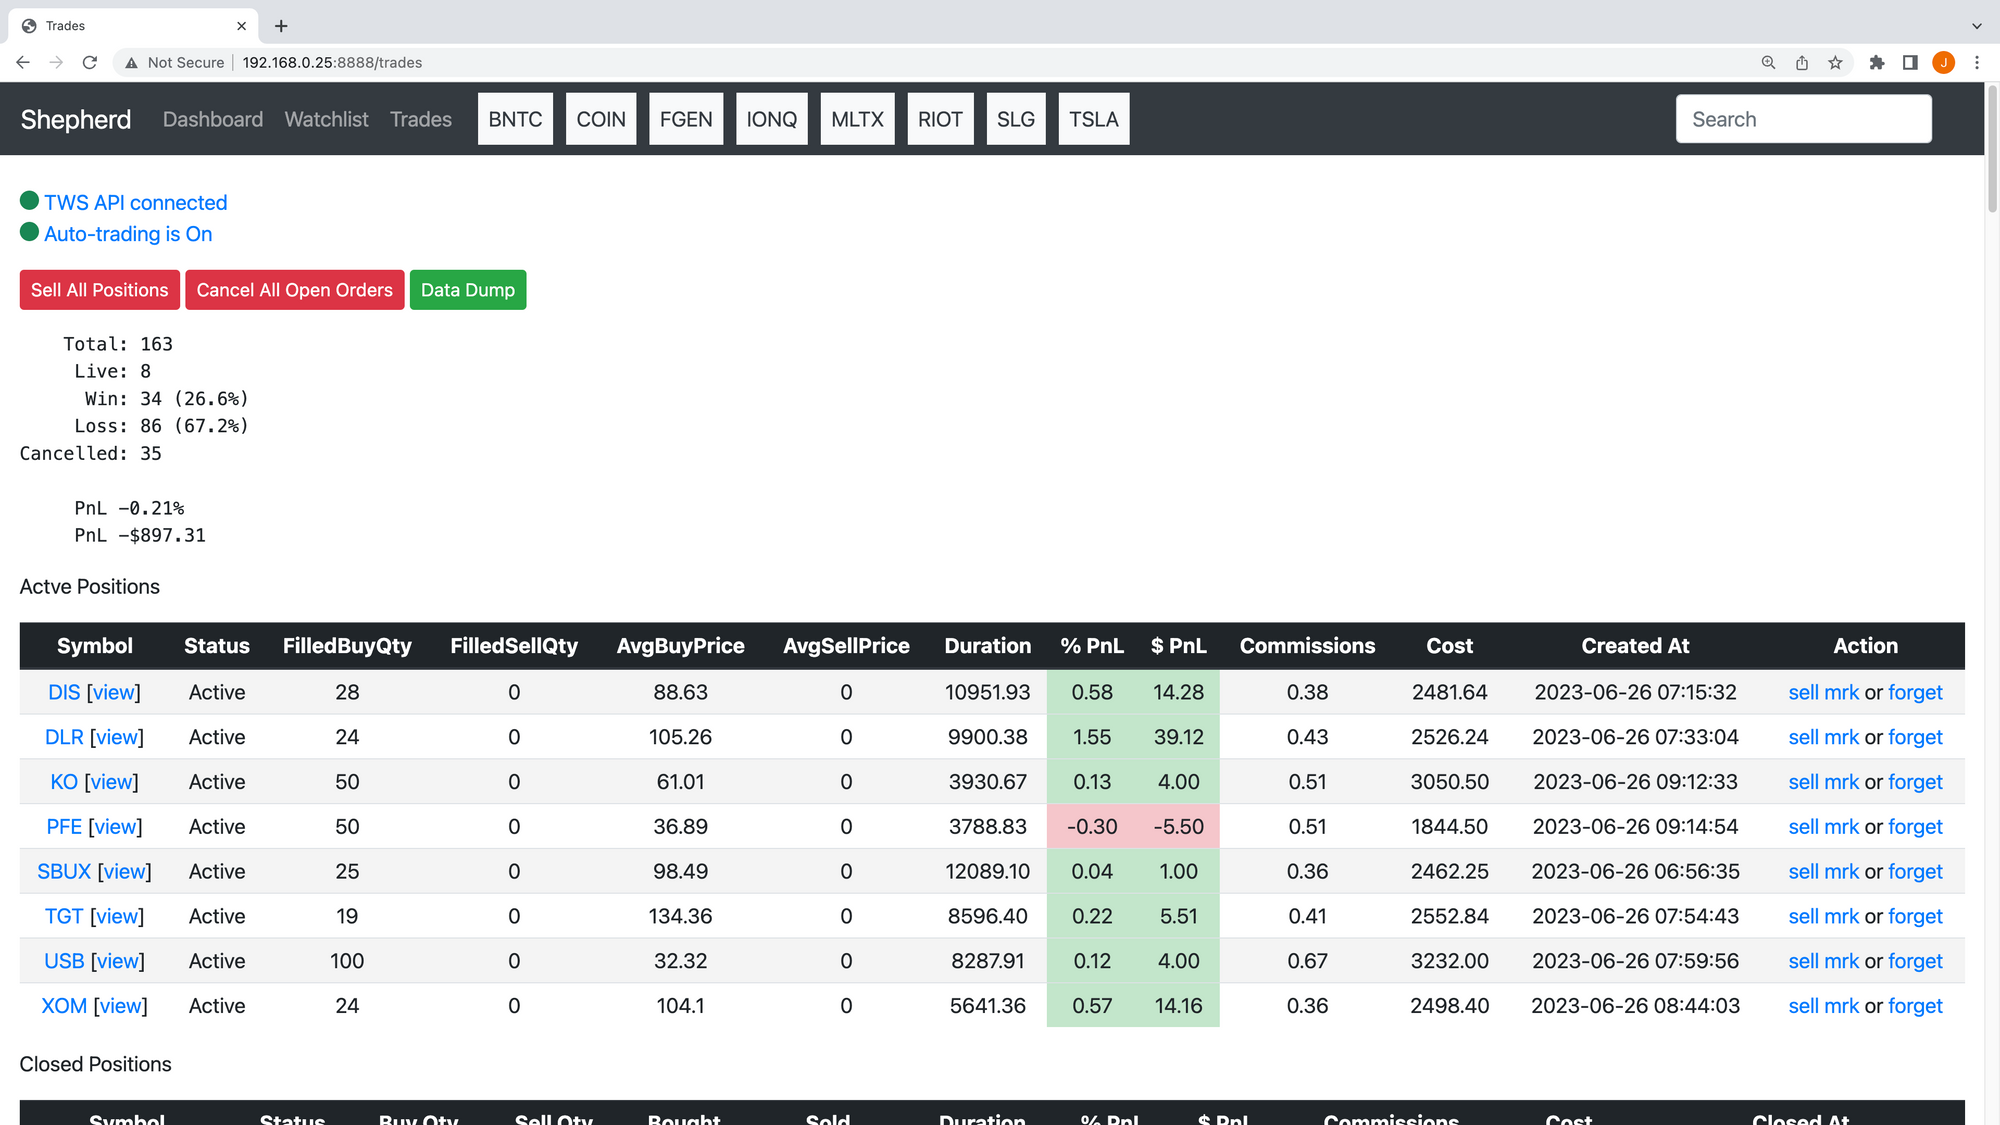
This interface displays the win/loss ratios and current open positions for active trades. You can see for this session we’re down about -$900. This bot doesn’t win all the time that’s for sure.
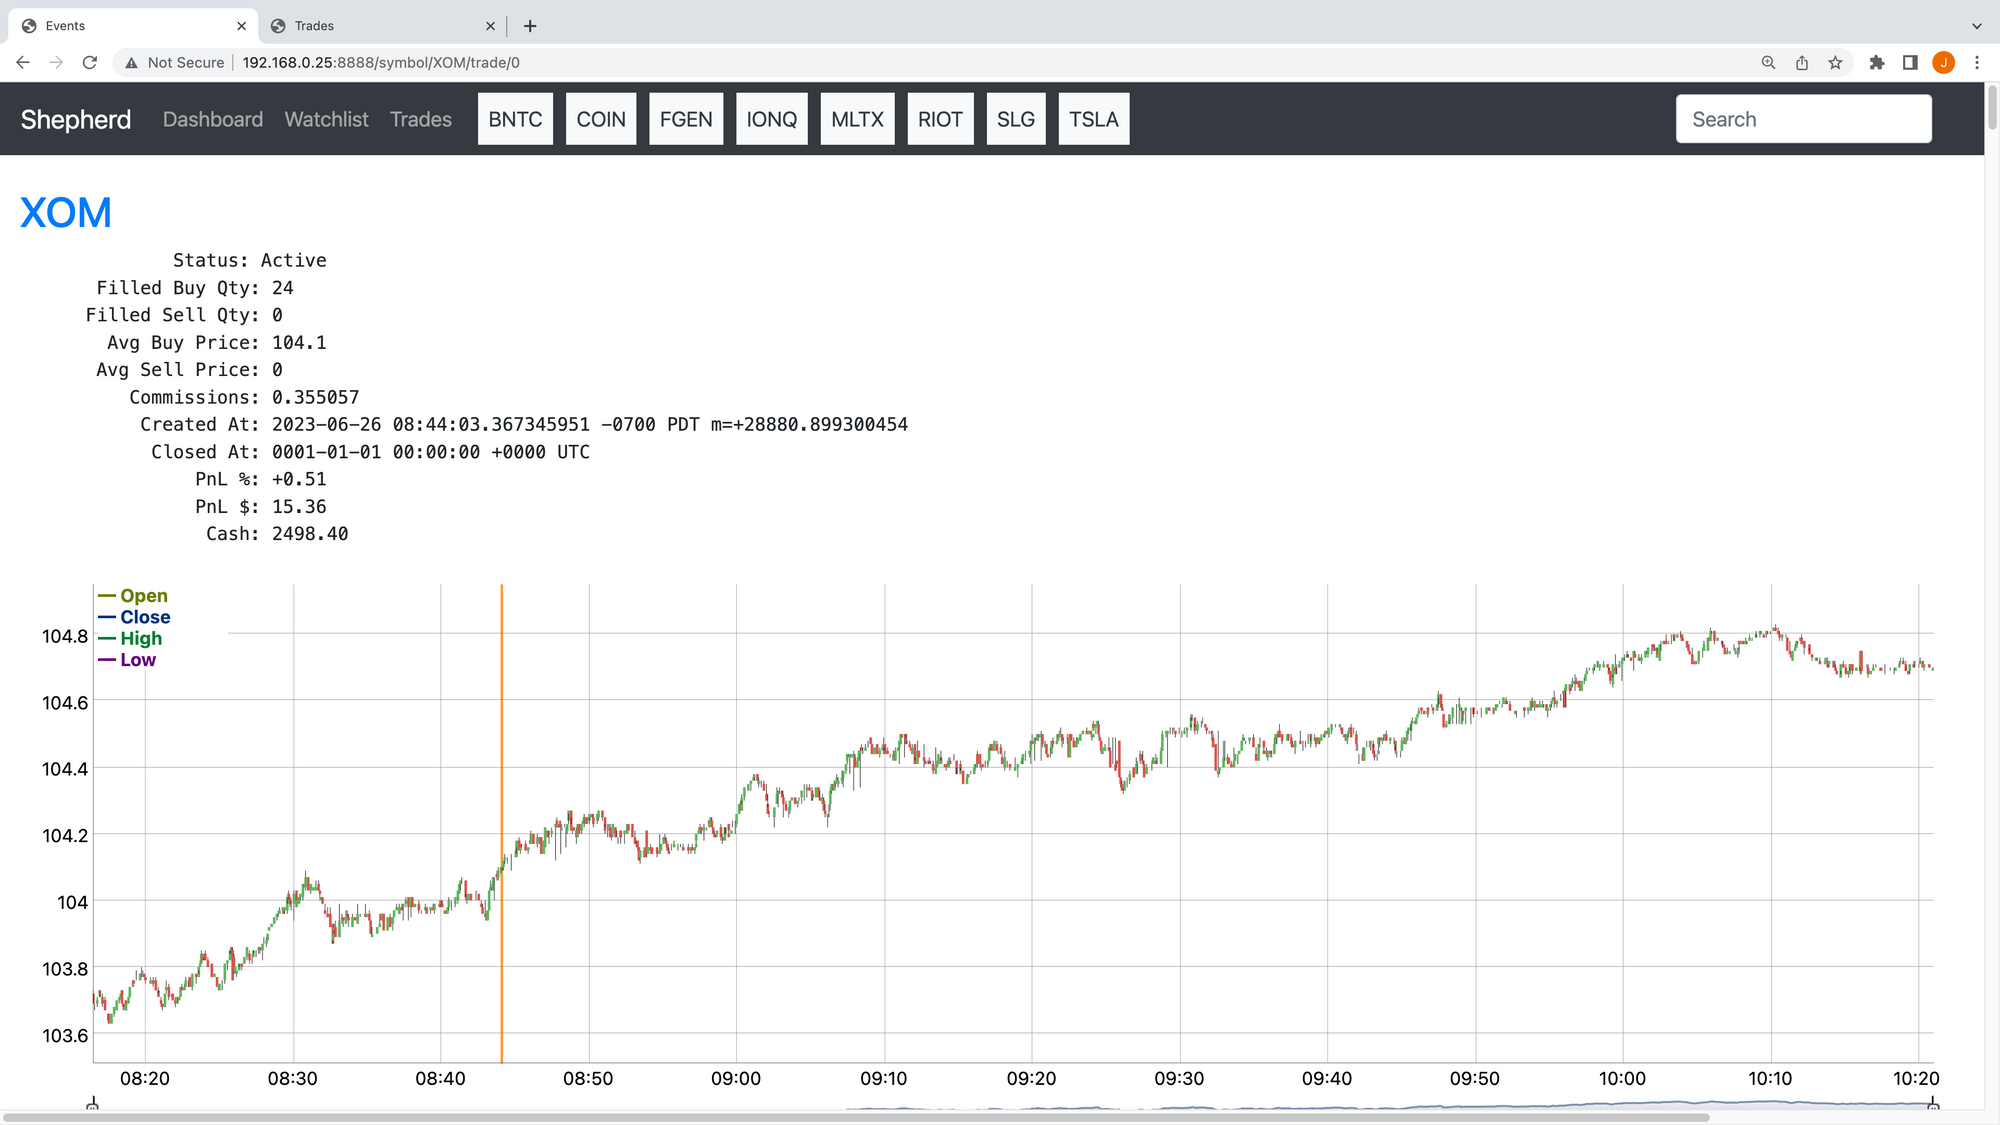
Here you’ll see a live trade in action, complete with all its associated metadata and an accompanying chart to visualize the trade’s progress. The orange line is where we bought 24 shares.
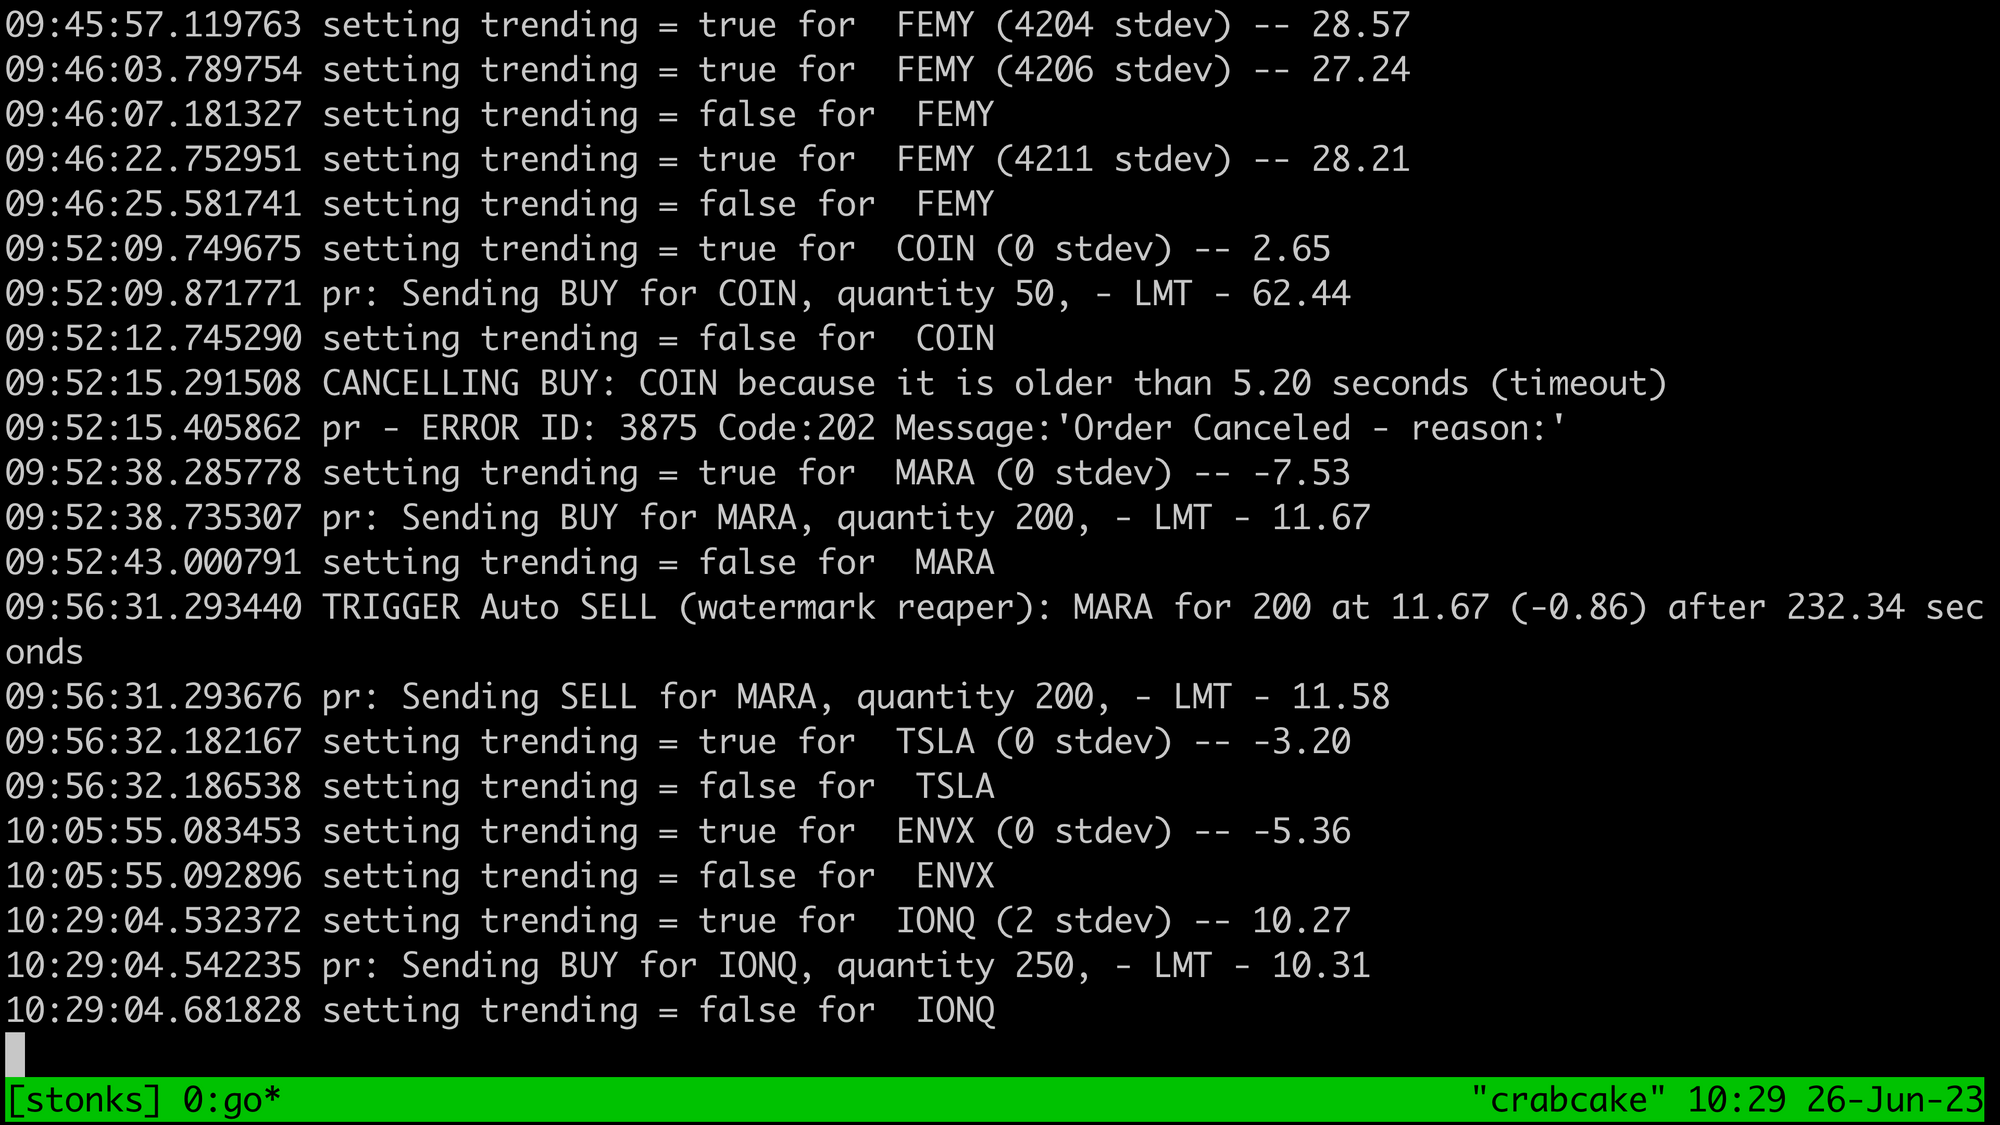
Lastly, a glimpse into the console that logs real-time events such as order placements, both buying and selling.
I hope these screenshots have shed some light on the inner workings of this trading tool and helped illustrate the key functionalities more vividly. My aim was to bring the abstract concepts and processes to life, making it easier for you to understand and appreciate the complexities of the system.
Strategy Development and Backtesting
You might be expecting to read about specific strategies and perhaps their associated Sharpe ratios. However, you won’t find that here. I think of the Go application, the strategies it employs, and backtesting as three distinct, yet equally crucial components. My primary focus has been on creating my own platform that allows me to test and run custom strategies in real-time, and also to backtest them. This aspect, the platform itself, seems to be often overlooked in most discussions. Many conversations revolve around strategies (mean reversion, trend following, linear regression, etc.), and backtesting, without fully addressing the practical mechanics or logistics of strategy implementation, particularly in the context of live, intraday trading.
In parallel to developing this platform, I’ve been leveraging the a wide range of historical trade and quote data provided by Polygon.io. This data is fundamental for exploring strategies using Python and backtesting them. Hence, the reason for the 8TB of NVMe storage on my machine. This approach enables me to download and structure the data, and then brainstorm and visualize potential trades. While it’s often said that backtesting is akin to trying to drive forward while looking in the rearview mirror, it provides a valuable sanity check and offers insight into past performance. This helps me to make educated guesses, especially about spread, taxes, commissions, entry, and exit points, among other factors.
Ultimately, the insights gleaned from strategy development and backtesting are translated into logic that is incorporated into the ‘BUY signal loop’. Algorithmic trading may sound sophisticated, but at its core, it’s about identifying trends and patterns and trying to capture them programmatically.
Now that we’ve covered the overview, let’s delve into some pseudocode to understand how it all comes together.
Code Examples
In the interest of giving you a more concrete understanding of how this system functions, I have included some high-level pseudo code and actual Go code samples below. These snippets provide a simplified depiction of the system’s structure and the logical flow it follows. Please note that the Go code, while outlining the essential data structures and steps, is not functional and just example code (the real app is around 7k lines). It’s merely a high-level depiction of how you might set up the primary data structures and routines in Go.
Create an empty map for symbols

Create a websocket connection to the trades and quotes websocket data feeds

While the websocket connection is open:
    Wait for events from the websocket

    If the event has a stock symbol (aka ticker):
        Extract the stock symbol from the event

        If the symbol is not in the symbol aggregates:
            Add the symbol to the symbol map (our in-memory index of all symbols)

        Update the symbol with the event data (add tick and quote data)
        Build a custom aggregate that merges tick and quote data (enrich data)

        For each aggregate in the symbol aggregates:
            If the aggregate triggers a buy event:
                Execute the buy event (if we do do not already own it)

        If we have an open position for this symbol (aka ticker):
            Check the status and see if we need to sell
                Execute the sell event
Here’s what that sort of looks like in Go. This code doesn’t work but gives you the high-level details of the major data structures.
type TrackedSymbols struct {
	Symbol              map[string]*Symbol // symbol map
	TradingEnabled      bool               // auto trading on/off
	L                   sync.Mutex         // global lock
}

type Symbol struct {
	Symbol          string           // TSLA, AAPL, etc
	RawTrades       []TradeEvent     // unprocessed trades
	RawQuotes       []QuoteEvent     // unprocessed quotes
	Aggregates      []Aggregate      // combined trades + quotes into tick bars
	Positions       []Position       // order tracking
	...
}

type TradeEvent struct {
    // Define the trade event structure, like symbol, price, volume, etc.
}

type QuoteEvent struct {
    // Define the quote event structure, like symbol, price, volume, etc.
}

type Aggregate struct {
    // Define the aggregate structure
}

type Position struct {
    // Define how you want to track orders
}

var trackedSymbols TrackedSymbols

func main() {

    // init the global map
    trackedSymbols.Symbol = make(map[string]*Symbol)

    // connect to polygon.io websocket for trades and quotes

    // data ingestion loop
    for {

    	// read messages
        _, message, err := c.ReadMessage()

        // parse trades and quote events (lots of logic in here for event types)
        event := parseEvent(message)

        // have we seen this symbol before?
        if _, ok := trackedSymbols.Symbol[event.Symbol]; ok {
            trackedSymbols.Symbol[event.Symbol] = Symbol{Symbol: event.Symbol}
        }

        // logic to turn trades + quotes into aggregates
        // use go channel to signal buy and sell logic

    }

    // new price event; buy loop
    for {
        // loops over all trackedSymbols.Symbol looking for buy signals
        // all your super secret signal trigger stuff goes here
    }

    // new price event; sell loop
    for {
        // loops over all trackedSymbols.Symbol.Positions looking for sell signals
    }

    // http server that enables you to inspect everything
    // - trackedSymbols.Symbol (all symbols)
    // - trackedSymbols.Symbol.Positions (all trades)
    // - build and view custom watch lists

}
The code presented here barely scratches the surface and is intended to providing a glimpse into the thought process and structure behind it. This includes defining key data structures, maintaining an in-memory index of symbols, handling real-time events, and integrating buy and sell trade logic. For a fully functional trading bot, you would need to incorporate much more sophisticated features but hopefully you get the idea.
Lessons Learned
Creating an automated trading tool has been nothing short of an adventure that crosses multiple domains, from finance and programming to data analytics. Through this project, I have come to learn and appreciate the complexity of the stock market and how hundreds of billions of dollars change hands each day. There are countless trading strategies out there and having your own platform to play around with them is incredibly cool. Once you have a system like this you cannot easily go back to a normal broker since you feel blind. I wanted to share of the key lessons out of all this:
- Understanding Abstractions: The stock market, and exchanges like NYSE are NASDAQ, are not monolithic entities but are actually large distributed systems built up from 19+ exchanges, each with its own quirks and features. Candlestick data is a massive abstraction built from raw trade or tick data, and understanding these abstractions at a deep level is essential. Then you have market trading times such as pre-market, regular market, or after-hours where different rules apply. Getting as close to the source data as possible and thoroughly understanding its origins and usage will significantly enhance your ability to leverage it.
- Order Management: It is not as simple as sending buy and sell orders. Factors such as pre-computed position sizing (the number of shares to buy and your total money percentage), the ability to quickly buy and sell shares, having the ability to manage 25+ active positions and act on them instantly, tax and commission calculations, slippage management, and order state monitoring all contribute significantly to successful trading.
- Edge Cases: Order execution, tracking, modifications, cancellations, partial orders, market halts and more, there are so many edge cases to consider and these cost you money if you miss something. It is absolutely essential to test these scenarios with simulated money, also known as paper trading, rather than real funds to minimize potential losses. I lost a lot of money when my system detected a trend in the pre-market and the stock jumped 40%, I bought at the absolute high, and then it quickly dropped, and my system did not adjust the sell order correctly. I basically lost 40% on that trade in minutes. You can make and lose money extremely fast in pre-market or after hours trading sessions since the normal market rules are different and you can see wild swings take place extremely quickly.
- Embrace Randomness: Many of us might be tempted to think that the key to a successful trading bot lies in discovering some secret, all-powerful strategy. While strategies are undeniably important, they are not everything. One of the most valuable lessons I learned was the utility of random buying to test the core functionalities of the system. For example, try to make 1000 trades per day across random stocks for a week and you’ll learn so much about your system. By introducing random buy orders into the system, you can effectively test your buying and selling logic, manage partial fills, test cancel logic, and critically evaluate the overall position tracking system. Does your system keep track of them as expected? Can you delve into the trade details? Do the positions exit based on the established criteria? Is the logging working as intended? I incorporated random stock buying using my paper trading account into my testing process, which turned out to be an incredibly efficient way to verify multiple aspects of the system simultaneously. Not to mention, it made testing a lot more unpredictable and fun.
- Tick Bars vs Time Bars: When you look at a candlestick bar offered by your broker, it will have an open, high, low, close, number of trades, volume, etc, this covers a known time frame, for example 30 seconds. However, the issue here is that there are times where the market is moving extremely quickly and not all bars are created equally, some might have 100 trades while others have 1,000s of trades in the same time span. So, I am taking the raw tick and quote data and building my own bars based off a set number of trades. This not only provides much better resolutions during times of increased trade activity, like market open and close, but also enables me to add in things like price spread, and other custom metrics. This is where really understanding the data you are using comes in and you can build your own abstractions rather than using someone else’s.
- Going In-Memory: In the early stages, I faced numerous challenges attempting to maintain state in a database because of the large spikes in activity around market open and close. Eventually, I decided to go entirely in-memory, utilizing a large map with mutex locking that virtually every component of my system interacts with. Although it was very challenging to construct and debug, this solution ultimately solved all my scalability issues. I configured the system to dump the struct that holds all data into a compressed gob file for storage, with a method to reload it in case I needed to restart the application. It can grow to be 40GB+ throughout the day and I needed to patch the Go build to support dumping gobs this large. This ensured no loss of my stateful data. Another lesson learned the hard way was the need for uninterruptible power supply. I found this out when a power outage occurred while my system was live. Without power, I lost all state data, leaving my positions unmonitored. A proper power backup system became a necessity to prevent such incidents from occurring in the future.
- Complex and Lonely: This project proved much more challenging and time-consuming than initially anticipated. As I said, this has turned from a minor hobby into a full blown obsession. It can be lonely too. All you are basically doing is trying to increase the money in your account. This can be an extremely wild roller costing.
- Using Go and Python: I have moved to a hybrid approach where my trading system is written in Go but I do most of my data exploring in Python just because it has extensive data science libraries, and it simplified certain aspects of looking at data or trying to find patterns.
- Leveraging Personal Computers: Modern desktop PCs are extremely powerful and able to handle real-time monitoring of the entire stock market if you hack on it enough.
- ChatGPT enters the Chat: ChatGPT has been a game-changer for me. With it, I can easily ask questions, use it for sanity checks, and even have it generate code. I went from not knowing how to solve a problem, blindly googling around and reading books, to just telling ChatGPT the problem, and then asking how it would solve it, then asking it to code the solution. This is absolutely insane and has easily 3x my productivity.
In retrospect, I would probably keep adding things here. For example, hunting down all types of market anomalies, things like the meme stock adventures, wild IPO events, market booms and busts, Fed news and interest rate hikes, all this just in the last few years. It’s pretty cool to have your own system to look at all this stuff, detect it, and then see it appear in the news. You definitely feel like you have a front row seat when market events are unfolding right in front of you.
Resources
I hope you found this at least entertaining and a somewhat useful guide, even if you are just interested in paper trading for now. Diving into a project like this allows you to gain a wealth of knowledge about programming, the stock market, and data analysis. Also, these insights and skills are likely to directly apply to problems you will encounter in your professional life too. I want to share a list of resources that I found invaluable during my journey.
- Mathematics With Applications In Finance
- Quantitative Finance Stack Exchange
- reddit.com/r/algotrading
- Advances in Financial Machine Learning
- Quantitative Trading: How to Build Your Own Algorithmic Trading Business
- Systematic Trading: A unique new method for designing trading and investing systems
- Algorithmic Trading: Winning Strategies and Their Rationale
- Trading Systems 2nd edition: A new approach to system development and portfolio optimisation
- Machine Learning for Algorithmic Trading: Predictive models to extract signals from market and alternative data for systematic trading strategies with Python, 2nd Edition
- Implementing Derivative Models
- First Course in Probability, A
- Bayesian Statistics the Fun Way: Understanding Statistics and Probability with Star Wars, LEGO, and Rubber Ducks
- The Man Who Solved the Market: How Jim Simons Launched the Quant Revolution
- Option Volatility and Pricing: Advanced Trading Strategies and Techniques, 2nd Edition