You can find the original article here. Written by @buildalpha
What is Monte Carlo Simulation?
Monte Carlo Simulation is a statistical technique that injects randomness into a dataset to create probability distributions for better risk analysis and quantitative decision-making.
The most common Monte Carlo Simulation randomizes the order of a data set to demonstrate an alternative path a data set could have experienced – this is particularly useful for algorithmic traders and trading systems to see different outcomes of past trades.
In financial markets, quantitative traders use the most common Monte Carlo Simulation method to reshuffle the order of their historical trades to help them better understand how a trading system could have happened.
Algo traders aim to answer the question, if the order of trades was not identical to the backtest’s order, would I still be comfortable trading this strategy?
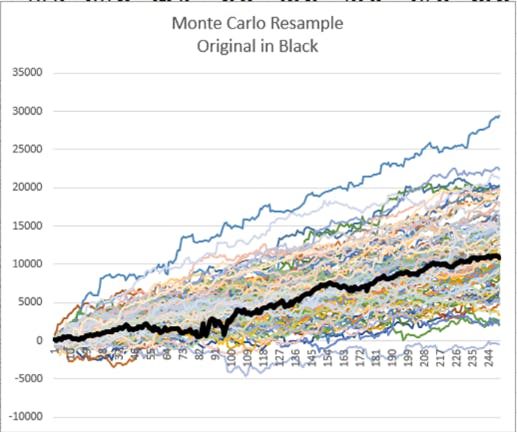
The equity curve, the cumulative profit of trade results, can provide insights into how smooth a trader’s account may grow following a particular algorithmic trading strategy. Monte Carlo provides a method of re-simulating the trading strategy to see how “bumpy” the ride could have been in an alternate reality and even acts as a peak into what the future may hold for the trading strategy.
The purpose of Monte Carlo Simulation is to detect lucky backtests and misleading performance metrics before risking real capital.
This video is a great introduction to Monte Carlo Methods: Monte Carlo Basics – Build Alpha
Why are Monte Carlo Simulations used?
Monte Carlo Simulations help better simulate the unknown and are typically applied to problems that have uncertainty such as: trading, insurance, options pricing, games of chance, etc. The goal is to gain a better understanding of all the possible outcomes and potential minimum and maximum values.
Traders use Monte Carlo simulations for a plethora of reasons from re-simulating trading systems to gaining a better understanding of the risk of a trading system.
Why re-simulate an equity curve? Algo traders use monte carlo simulations to determine how much luck was involved in a strategy’s backtest and if future performance is likely to look like past performance.
If the trading system was overly lucky, then it would be nice to know before risking real capital in live trading.
A trader may backtest a trading strategy and notice an acceptable maximum drawdown; however, after running a monte carlo test the drawdown may be much less tolerable. This Monte Carlo method could save the trader from risking capital on a strategy he could not stomach in live trading.
The main uses for Monte Carlo simulations in trading simulation are:
- Better understanding of possible trading drawdown
- The proper funding of a trading strategy
- Understanding possible win and loss streak potential
- Setting better profit and loss expectations
Benefits of Monte Carlo Simulation
Better understanding of drawdown and future outcomes
reshuffling the order of your trades can lead to different profit and loss sequence which can result in a greater drawdown. A trader may believe the backtest’s drawdown is the worst it can get, but monte carlo analysis may show a much larger drawdown for most trading systems.
Properly fund your trading strategy
noticing a larger maximum drawdown from a monte carlo simulation can help a trader better capitalize a trading strategy. This can make a live drawdown more bearable and allow the trader to stick to the original plan. On the other hand, a trader that experiences a live drawdown greater than the backtest’s drawdown may prematurely turn off a trading strategy if not familiar with monte carlo simulations.
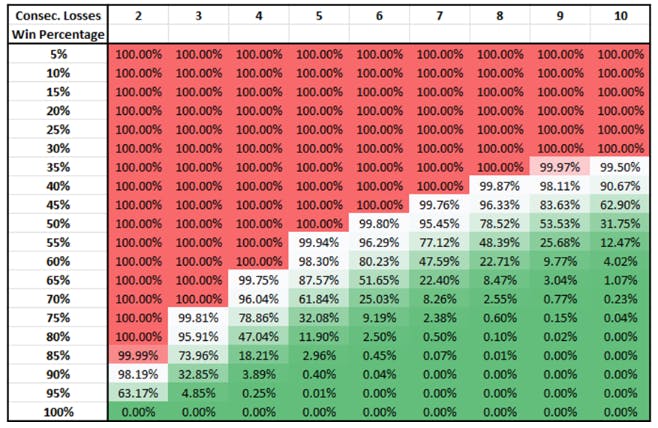
Understanding possible win and loss streaks
the backtest may show a maximum of 5 or 6 losing trades in a row but a monte carlo test may show that 8 or 9 losing trades in a row is possible. The trader can better prepare for this adverse situation equipped with insights from a monte carlo simulation. Some traders may not be able to withstand consecutive losing trades and a monte carlo simulation may help traders avoid systems susceptible to such strings of losses.
Set better expectations with quantitative analysis
many traders view the backtest as a guide for what to expect. For example, a trading system shows an average trade of $500 so a trader assumes in 10 trades I should expect to make $5,000. However, a monte carlo test may show a wide range of possible profit and loss scenarios after 10 trades. This data analysis can help a trader remain calm enough to stick to the strategy when luck becomes favorable or unfavorable.
Monte Carlo Testing for Drawdowns
Beginner traders find a successful backtest and think they have struck gold. However, many beginning traders are misled by overly optmistic backtests. Often the most important performance metrics such as net profit, standard deviation of historical trades, and consecutive winning trades will be inflated.
The maximum drawdown from a backtest is often the most misleading metric!
Monte Carlo Analysis helps traders better estimate a strategy’s drawdown potential which can help traders stick to a strategy during inevitable drawdowns.
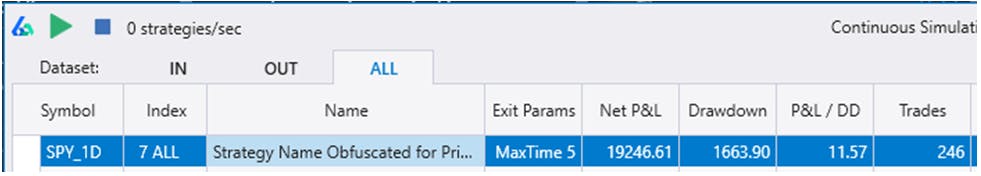
This example strategy below shows a backtest drawdown of $1,663.90.
However, after running a simple Monte Carlo Simulation on the same trading system we can see the worst resample drawdown from all simulations is $5,195.17 or 3.1 times as large as the backtest’s drawdown!
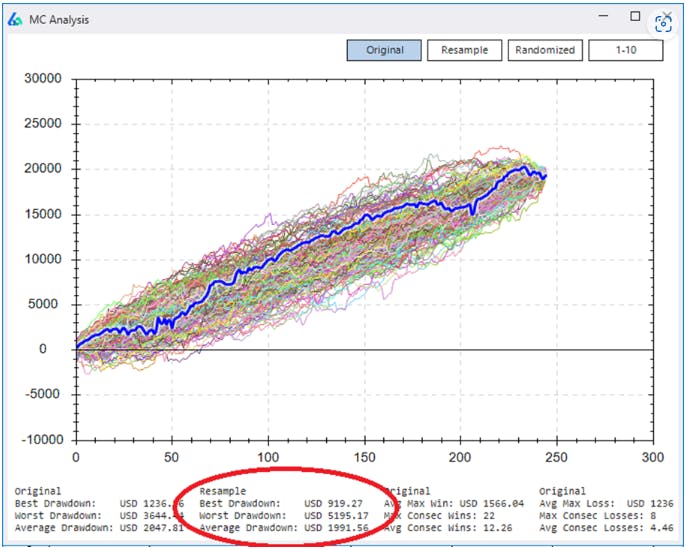
A trader sized based on the backtesting would prematurely cease trading and turn a potentially winning strategy off or not have enough capital allocated to properly trade this strategy. A simple monte carlo analysis could prevent this.
Monte Carlo Methods: Different types and uses
Reshuffle
this monte carlo method reshuffles the historical trade order 1,000 times creating 1,000 new equity curves. Each equity curve has its own performance metrics such as maximum drawdown and consecutive losing trades. This method reshuffles the original trades, so all 1,000 equity curves end at the same total profit and loss amount.
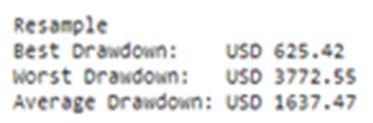
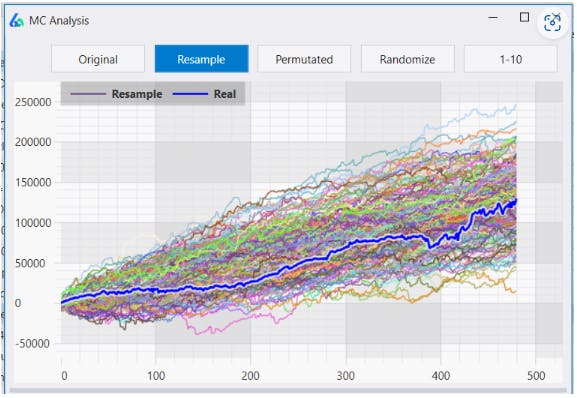
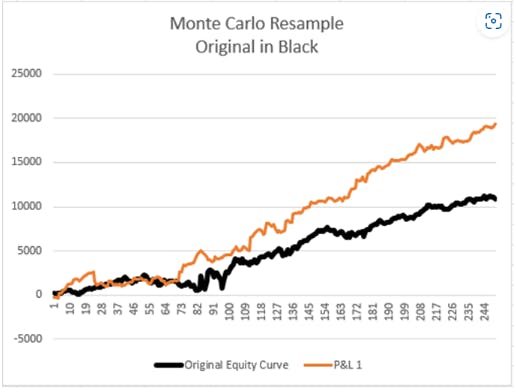
Resample
This monte carlo method continuously and randomly selects a historical trade with equal chance from all the trades until reaching the backtest’s trade count. This uses random sampling with replacement meaning the same trade can be selected and not every trade must be selected. This process is done 1,000 times to create 1,000 new equity curves. Each curve has its own performance metrics. However, resampling with replacement means not all simulations end at the same amount.
Randomized
The randomized monte carlo analysis technique re-trades the original strategy’s entries while randomizing each trade’s exit. The randomized exit only uses exit logic from the original strategy. That is, if the original strategy did not use a stop-loss then the randomized exit should not include a stop-loss. A strategy with a max hold of two bars may exit after one bar on the first trade but after three bars on the second, etc.

If the Randomized Monte Carlo results remain profitable, then it is likely our entry contains some true edge. The above example saved us from a lying backtest.
Read more on robustness testing for algorithmic trading strategies here: Robustness Tests for Algo Trading and please view a Randomized Test case study here: Free Friday 8 – Randomized Monte Carlo
Permutation
This monte carlo method applies to the historical data. First, we reshuffle the log of inter and intrabar price changes then exponentiate to recreate new bars. Re-trade our trading system on the 1,000 newly created synthetic data series.
The new permutated data contains the statistical properties of the original data but destroyed most of the patterns. Profitable results are a good sign the strategy is robust to withstand variations in the underlying data. It is a bonus to see our original trading system in the top trading results.
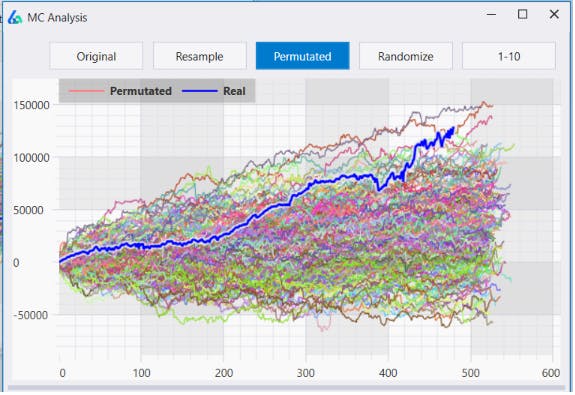
If the trading system fails on the permutated data or has many permutated results below or around $0 P&L, then it is time to find a new strategy and stop trading that system.
Advanced Uses of Monte Carlo Simulations for Trading Systems
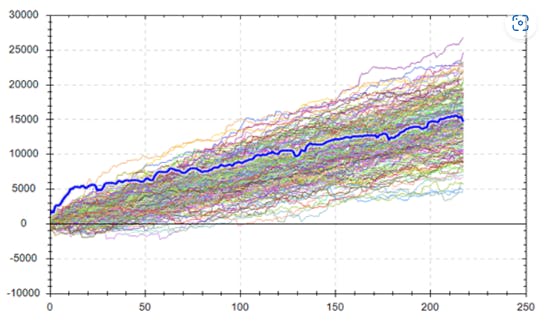
Monte Carlo Equity Curve Bands
Is my trading strategy broken? If a trader wants to know his expected profit in the next 100 trades, then he can randomly select 100 historical trades and add them to the end of the backtest’s equity curve. Repeat this 1,000 times and keep the 5th and 95th percentile equity curves to represent where the trader should expect to be 90% of the time in the next 100 trades.
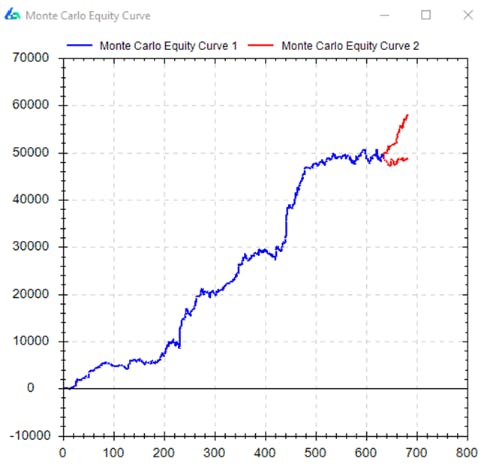
If future trading performance falls outside these monte carlo simulation equity bands, then it is an early warning sign the strategy is broken.
Monte Carlo Simulation Drawdown Technique
How confident am I in this strategy’s drawdown? This technique uses the monte carlo simulation resample method to create 1,000 new equity curves which simultaneously creates 1,000 new drawdown values.
We then plot the drawdowns as a histogram (green) along with a cumulative distribution line (blue). The blue line represents the total percentage of drawdowns as we move from left to right across the horizontal x-axis.
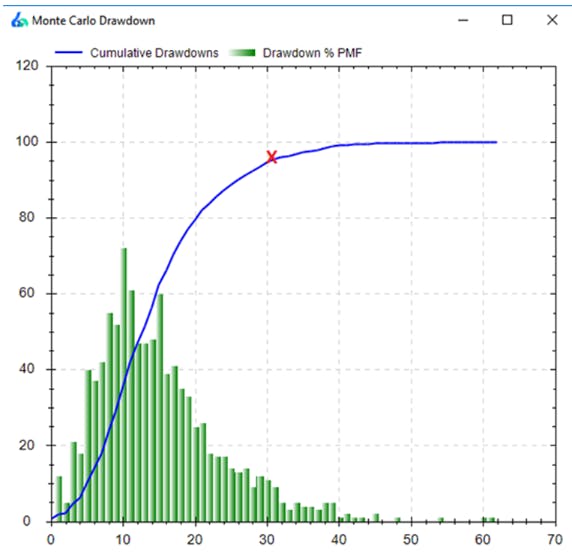
The red X indicates where 95% of all monte carlo drawdowns were less than the corresponding drawdown value on the x-axis. In this case, we can say “we are 95% confident that drawdowns from this system will not exceed 30%”.
To improve the drawdown percentage, the trader should change the input variables. Either increase the starting capital allocated to the strategy or adjust the acceptable drawdown percentage. Understanding the drawdown probability distributions and sizing with statistical confidence can make drawdowns easier to manage.
To learn more please check out the Monte Carlo Drawdown Analysis section of the Complete Algorithmic Trading Guide or view this case study Properly Funding a Trading Strategy with Monte Carlo Drawdown.
Furthermore, I wrote an article for See It Market that covers the three primary uses of Monte Carlo Simulations: 3 Uses for Monte Carlo Simulations in Trading
How many Monte Carlo Simulations are needed?
The ideal number of monte carlo simulations for valid results is 1,000 or more. To truly leverage the law of large numbers and get reliable monte carlo simulation results one should strive for 1,000 or more simulations; however, results are generally acceptable with 100 or more simulations.
The purpose of monte carlo simulation is to detect lucky historical data backtests and misleading performance metrics in our trading ideas. However, running a single monte carlo simulation could create a lucky test result. Imagine a Resample test that luckily resamples only winning trades and creates an incredible equity curve.
Is this likely? No. Is this possible? Yes. Should we base trading decisions on this?
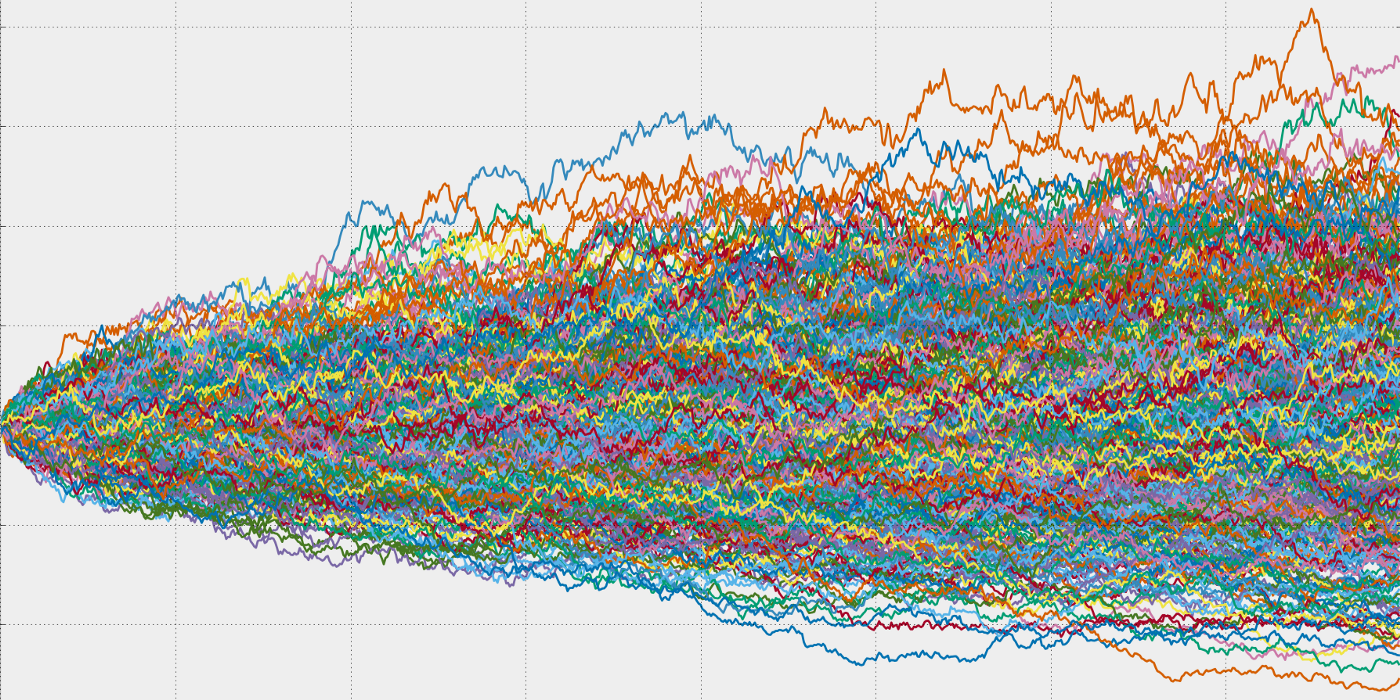
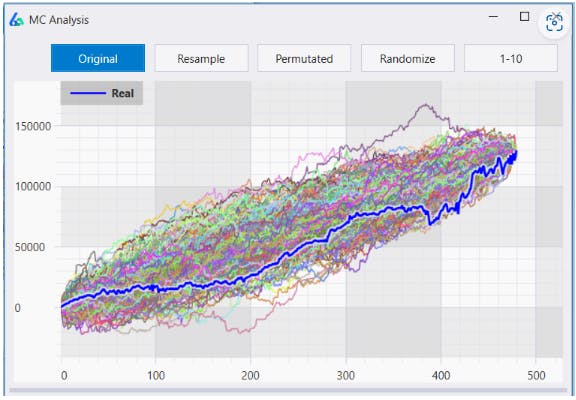
To avoid a lucky result like the above, we want to run 100 or 1,000 tests in order to ensure we have a good estimate of the median or average result. That is why all the monte carlo simulation images contain hundreds of equity curve lines.
There still may be lucky results, but we can get a better sense of what is reasonable to expect from a larger probability distribution than a single simulation.
Equity Curve Simulator and Probability Distribution
An equity curve simulator is a tool that accepts winning percentage, average win, and average loss amounts to simulate how an equity curve’s sequence may happen. It is very important to note that a trader can be profitable with a lower winning percentage and larger winning trades or with smaller winning trades and a higher winning percentage.
To learn more about expected value please check out the complete guide to Algorithmic Trading.
Look at this expected value display below to see how winning percentage and average win-to-loss ratio affect profitability:
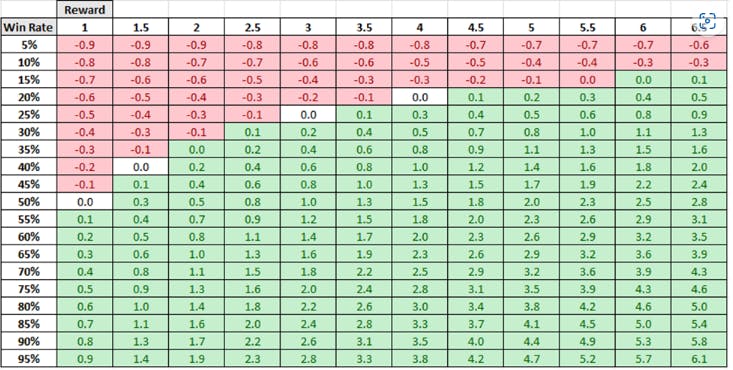
All values are based on a $1 risk. 2.5 Reward indicates a profit of $2.5 and a loss of $1
I have built a free equity curve simulator where you can input your expected winning percentage, average winning trade and average losing trade to simulate your expected equity curves.
Knowing how these values cooperate can help with algorithmic trading strategy design, risk management, avoiding a poor strategy, and analyzing trading results.
Monte Carlo Simulation Excel
Microsoft Excel is often good enough for simple quantitative trading endeavors. I have built a simple excel monte carlo simulation that you can import your trades and simulate various equity curve paths.
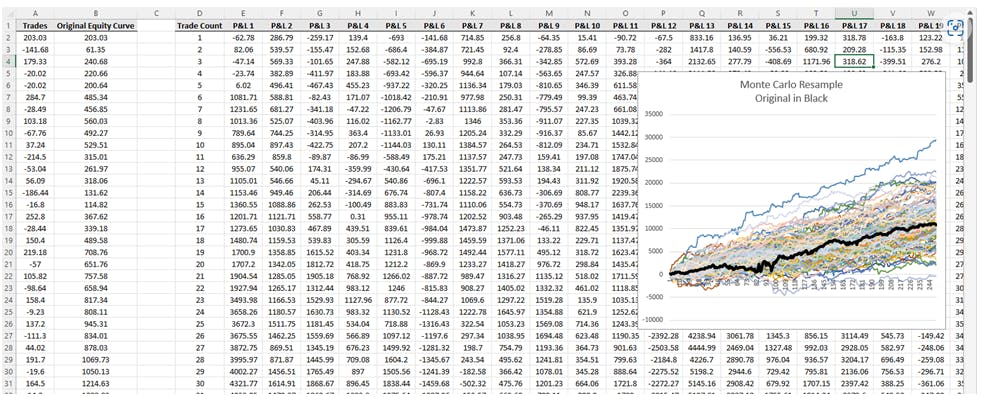
Simply copy and paste your trades into column A and it will generate your equity curve in column B. Then drag columns D:N down to end at the same row number as total trade count. That is, column A and columns D:N should end at the same row. Then to simulate a new monte carlo test press ‘F9’.
To download this Microsoft Excel Monte Carlo spreadsheet please visit here: link and to read more about monte carlo simulation from Microsoft please head here: Introduction to Monte Carlo simulation in Excel (microsoft.com)
Algo Trading Software for Monte Carlo Analysis: Build Alpha – The Best Monte Carlo Tool
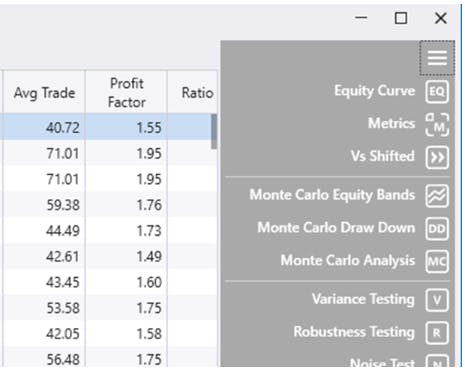
Build Alpha is a powerful automated trading software that enables traders to create hundreds of algorithmic trading strategies with no programming needed. Any strategy created can be put through all the Monte Carlo Methods listed in this guide. Simply highlight the desired strategy in the results window, then select the Monte Carlo Analysis option on the right-hand side.
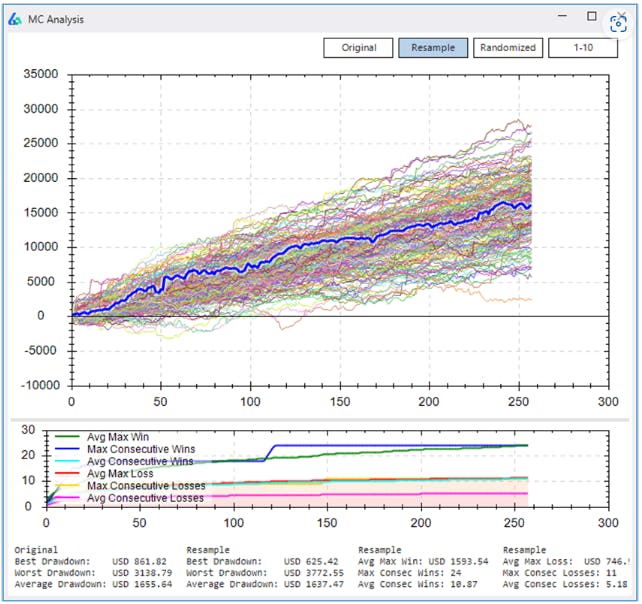
Build Alpha also returns statistics on winning and losing streaks from the simulations. This can help a trader understand what to expect as consecutive winning or losing trades occur.
You will see additional buttons on the right-hand side for the advanced monte carlo methods of Monte Carlo Equity Bands and Drawdowns.
What is the best Monte Carlo Simulation?
There is no best method as each method has different intended uses for the algo trader. For example, the reshuffle and resample are primarily used to get a better estimate of drawdown and risk analysis.
On the other hand, randomized and permutation tests are used for strategy robustness and future viability. These can be thought of as stress tests for a trading system.
Monte Carlo Drawdown technique is similar to reshuffle and resample but puts an emphasis on creating confidence intervals around the actual expected drawdown.
Finally, the monte carlo equity bands or probability cones are used to monitor live trading and identify broken strategies. There is no best monte carlo method as a professional quant trader should incorporate all into the strategy development process.
Key Takeaways
- Monte Carlo simulation is a statistical technique to help uncover luck in backtests
- Most popular Monte Carlo method is to reshuffle historical trades to view alternative account paths
- Can help estimate realistic drawdowns and possible outcomes
- Can help size trading strategy properly
Monte Carlo Method Need-to-Knows
- There are many different Monte Carlo Methods
- Inserting randomness or random values into historical trade results to better estimate uncertainty
- Drawdown estimation is the most common use of monte carlo analysis
- Large number of simulations needed to create proper probability distribution. 100 minimum but 1,000 or more is ideal
- Can be used to monitor strategy performance and identify broken strategies
Monte Carlo Summary for Algo Trading
Monte Carlo Simulation works in various ways. The most popular monte carlo methods are used to help traders identify luck and more appropriate drawdown measures than a simple backtest can provide. Reshuffle and resample monte carlo methods help traders simulate various equity curves with alternative trade sequences to view potential outcomes occurring.
Monte Carlo Randomized and Permutation tests aim to test strategy robustness and act as a stress test for trading strategies prior to real risk-taking. Monte Carlo equity bands aid traders in identifying early signs of a broken strategy. Finally, MC Drawdown assists traders find proper confidence intervals around drawdowns to ensure the strategy is funded with enough capital for the trader’s risk tolerances.
Monte Carlo Simulations are arguably the most popular quantitative trading tool to add to your algorithmic trading toolbox. More advanced readers can experiment with altering the probability density function or random number generator to make MC selections. I will save this and other variables for another discussion.


Awsome post.
I just wanted to know how or where can I download the excel spreadsheet you mention in the blog?
Hope to hear from you soon.